本文将详细介绍下Flink中的指标实现,包括自带的指标名和如何自定义指标。还会介绍下现在已经支持的reporter,如jmx、slf4j、influxdb、graphite、prometheus、pushgateway等。
最后介绍下flink指标平台化实践。
flink-metrics-core
- Metric:
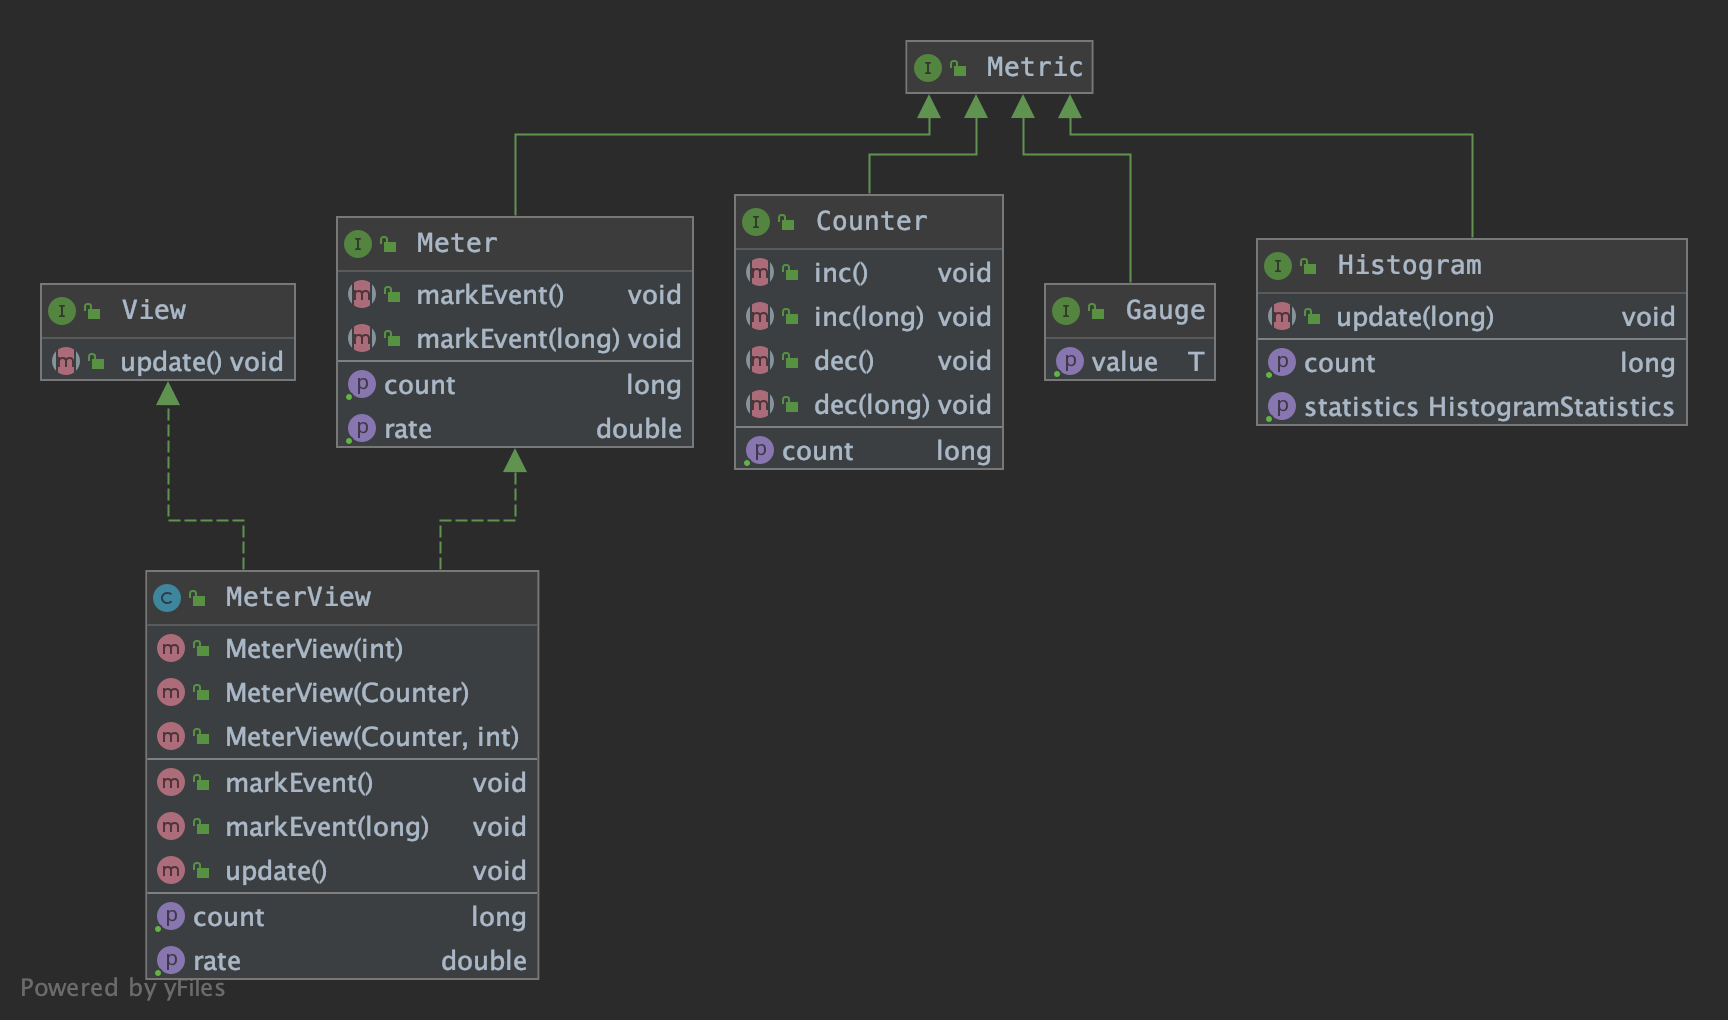
指标类型有Gauge、Count、Meter、Histogram。
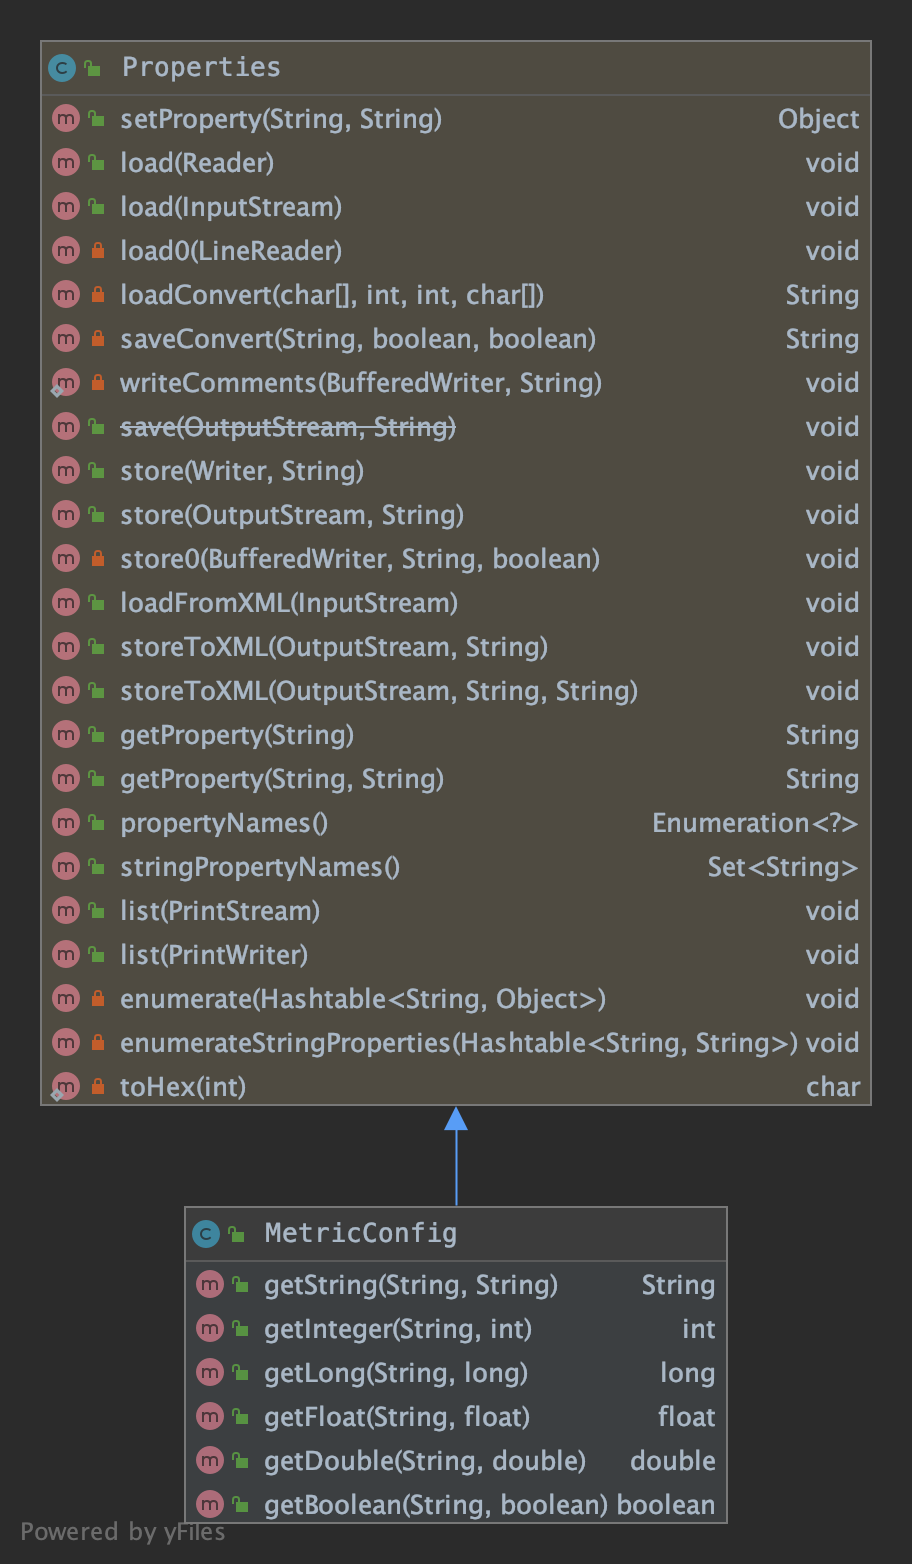
MetricConfig:
MetricGroup:
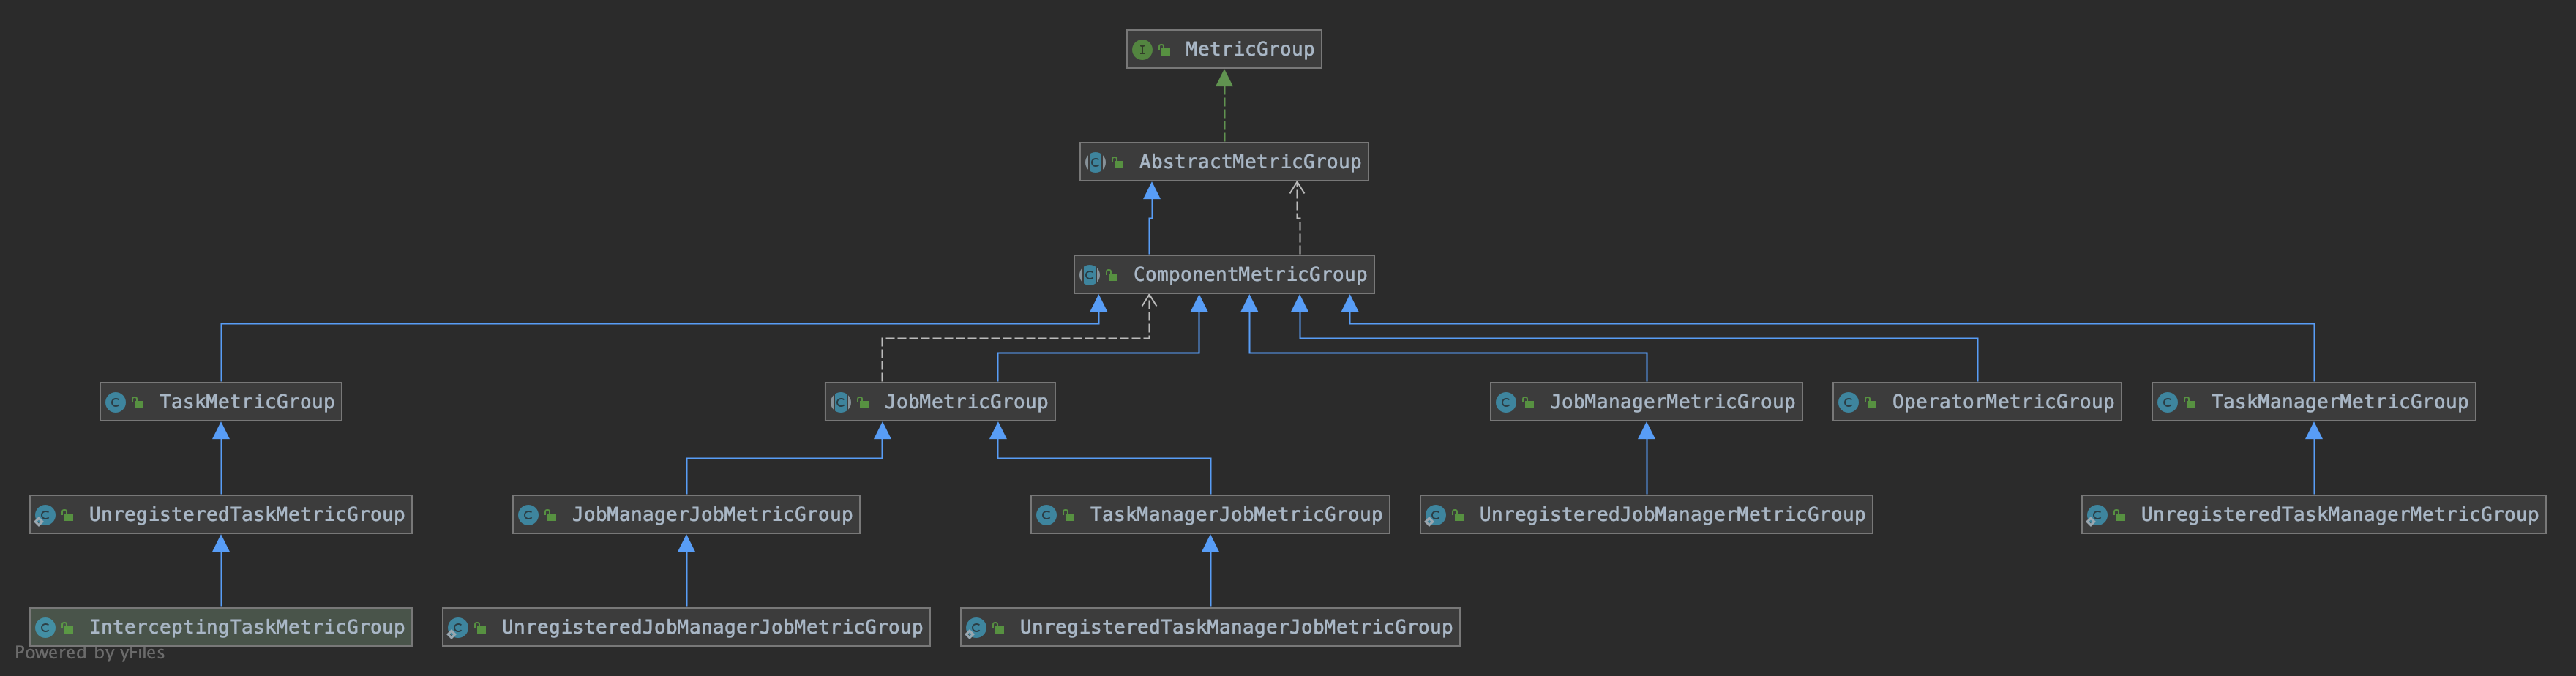
Metric 在 flink 内部以 Group 的方式组织,有多层结构,Metric Group + Metric Name 是 Metric 的唯一标识。
1 | TaskManagerMetricGroup |
可以根据需要埋点自定义指标。
添加一个统计脏数据的指标,指标名为flink_taskmanager_job_task_operator_dtDirtyData :
1
2// 从 RichFunction 中 getRuntimeContext()
dirtyDataCounter = runtimeContext.getMetricGroup().counter(MetricConstant.DT_DIRTY_DATA_COUNTER);添加一个消费延迟指标,自定了两层Group,分别是topic、partition,指标名为flink_taskmanager_job_task_operator_topic_partition_dtTopicPartitionLag :
1
2
3
4
5for(TopicPartition topicPartition : assignedPartitions){
MetricGroup metricGroup = getRuntimeContext().getMetricGroup().addGroup(DT_TOPIC_GROUP, topicPartition.topic())
.addGroup(DT_PARTITION_GROUP, String.valueOf(topicPartition.partition()));
metricGroup.gauge(DT_TOPIC_PARTITION_LAG_GAUGE, new KafkaTopicPartitionLagMetric(subscriptionState, topicPartition));
}MetricReporter:
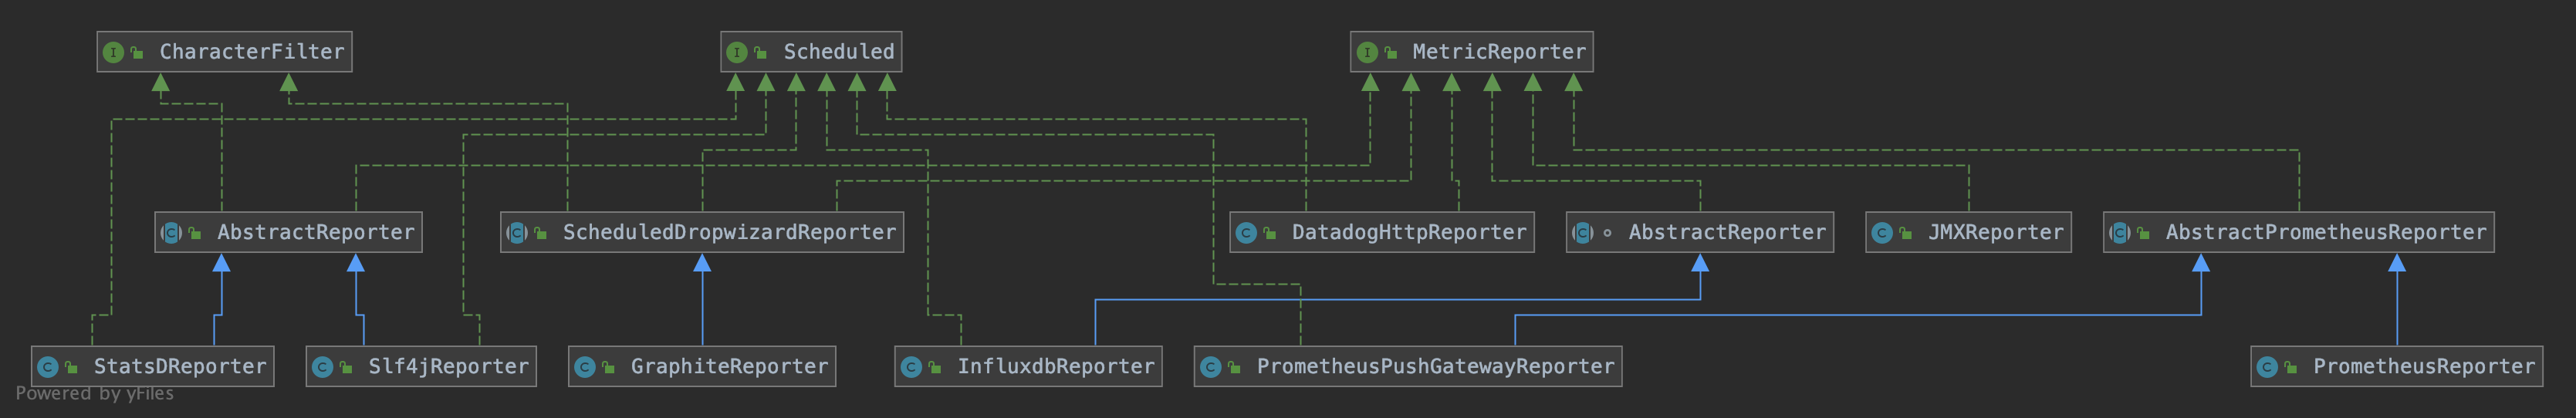
flink 内置了多种指标 reporter ,如jmx、slf4j、graphite、prometheus、influxdb、statsd、datadog等。
指标 Reporters
flink-metrics-dropwizard
只是将flink内部定义的指标org.apache.flink.metrics.Metric和dropwizard中定义的指标com.codahale.metrics.Metric接口和子类互相包装转换。
并且实现了 ScheduledDropwizardReporter :
1 | public static final String ARG_HOST = "host"; |
只有flink-metrics-graphite模块会引用这个模块,直接复用 dropwizard 包提供的 GraphiteReporter 功能。
flink-metrics-graphite
GraphiteReporter 继承了 flink-metrics-dropwizard 模块中的 ScheduledDropwizardReporter。
只需要实现其中的 getReporter() 抽象方法:
1 |
|
配置
- 复制 flink-metrics-graphite-xxx.jar 到 $FLINK_HOME/lib 下
- 在 flink-conf.yml 增加如下配置:
1
2
3
4metrics.reporter.grph.class: org.apache.flink.metrics.graphite.GraphiteReporter
metrics.reporter.grph.host: localhost # Graphite server host
metrics.reporter.grph.port: 2003 # Graphite server port
metrics.reporter.grph.protocol: TCP # protocol to use (TCP/UDP)
flink-metrics-influxdb
influxdb基本概念
使用方法参考:时序数据库 Influxdb 使用详解
为了方便理解 InfluxdbReporter 的实现,这里简单说下 Influxdb 中的几个概念:
1 | name: census |
timestamp
既然是时间序列数据库,influxdb 的数据都有一列名为 time 的列。field key,field value,field set
bufferflies 和 honeybees 为 field key,它们为String类型,用于存储元数据。
数据 12-7 为 bufferflies 的field value,数据 23-22 为 honeybees 的field value。field value可以为String,float,integer或boolean类型。
field key 和 field value 对组成的集合称之为 field set,如下:1
2
3
4
5
6
7
8butterflies = 12 honeybees = 23
butterflies = 1 honeybees = 30
butterflies = 11 honeybees = 28
butterflies = 3 honeybees = 28
butterflies = 2 honeybees = 11
butterflies = 1 honeybees = 10
butterflies = 8 honeybees = 23
butterflies = 7 honeybees = 22
在 influxdb 中,field 是必须的,但是字段是没有索引的,如果字段作为查询条件,会扫描所有符合查询条件的所有字段值。相当于SQL的没有索引的列。
- tag key,tag value,tag set
location 和 scientist 是两个tag,location 有两个 tag value:1和2,scientist 有两个 tag value:langstroth 和 perpetua。
tag key 和 tag value 对组成的集合称之为 tag set,如下:1
2
3
4location = 1, scientist = langstroth
location = 2, scientist = langstroth
location = 1, scientist = perpetua
location = 2, scientist = perpetua
在 influxdb 中,tag 是可选的,但 tag 相当于SQL中有索引的列,因此强烈建议使用。
measurement
指标项,是 fields,tags 以及 time 列的容器。retention policy
数据保留策略,默认是 autogen,表示数据一直保留永不过期,副本数量为1。series
指共享同一个 retention policy,measurement 以及 tag set 的数据集合,如下:
1 | | Arbitrary series number | Retention policy | Measurement | Tag set | |
- point
指的是同一个series中具有相同时间的 field set,points 相当于SQL中的数据行。如下:
1 | name: census |
- database
一个数据库可以有多个 measurement,retention policy,continuous queries以及user。提供InfluxQL语言查询和修改数据。
Reporter实现
InfluxdbReporter的详细类图如下,包括继承以及依赖关系: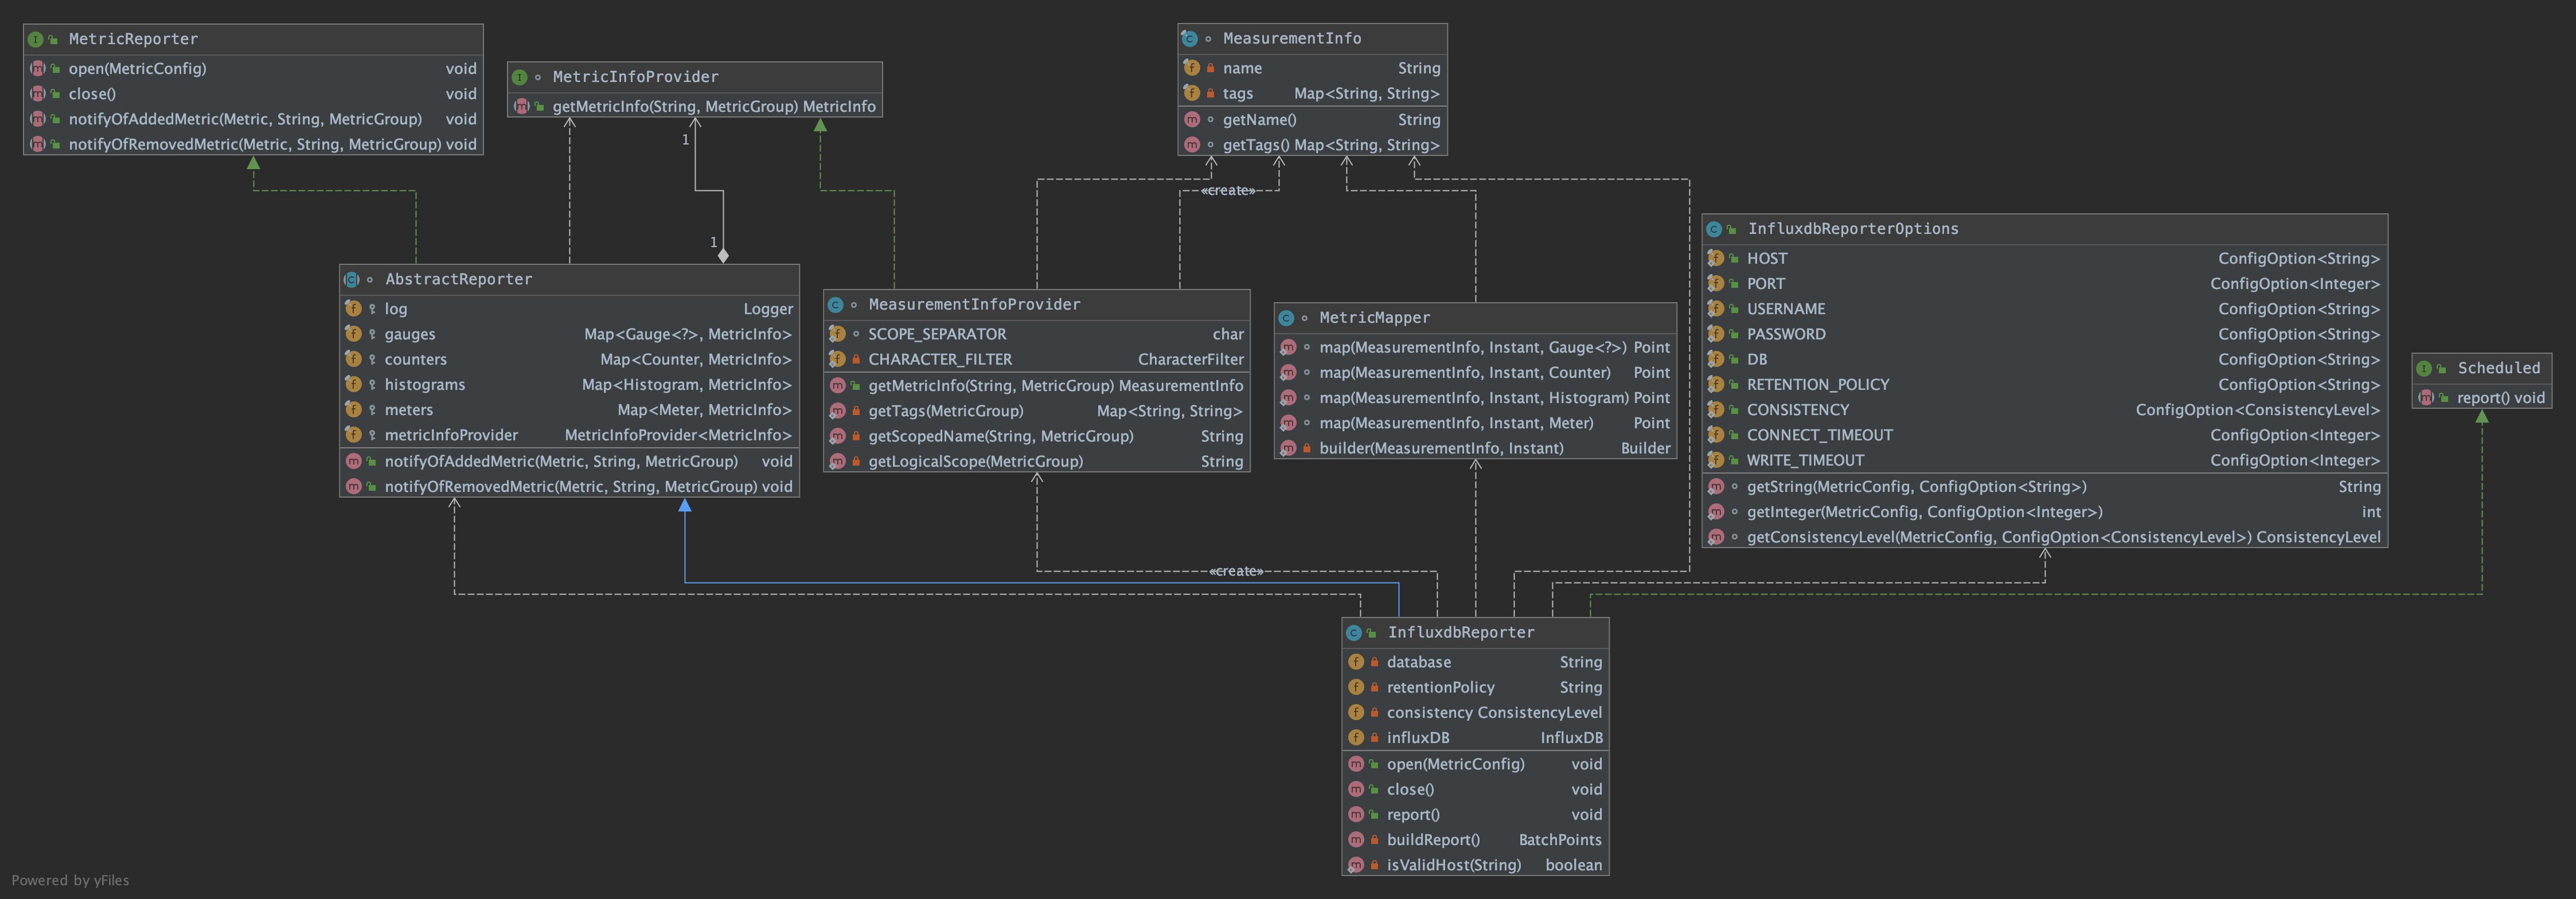
MeasurementInfo
1
2
3
4
5
6
7
8/**
* 指标项名称
*/
private final String name;
/**
* tag key 和 tag value对集合
*/
private final Map<String, String> tags;MeasurementInfoProvider
1
2
3
4
5
6
7/**
* 根据 metricName 和 MetricGroup,将该指标项封装成 MeasurementInfo 返回
*/
public MeasurementInfo getMetricInfo(String metricName, MetricGroup group) {
return new MeasurementInfo(getScopedName(metricName, group), getTags(group));
}InfluxdbReporterOptions
连接 influxdb 写指标的配置项,类似正常写RDBMS需要的配置MetricMapper
将 MeasurementInfo 转成 influxdb 中的 PointInfluxdbReporter extends AbstractReporter
构造函数中设置 MeasurementInfoProvider:
1 | public InfluxdbReporter() { |
open() 方法中要根据指标配置文件初始化 InfluxDB 操作类:
1 | /** |
AbstractReporter 中的 notifyOfAddedMetric() 方法中添加指标时将 flink 内部定义的 Metric 转成 MeasurementInfo:
1 |
|
report()方法要将 MeasurementInfo 转成 influxdb 中的 Point 对象:
1 |
|
配置
- 复制 flink-metrics-influxdb-xxx.jar 到 $FLINK_HOME/lib 下
- 在 flink-conf.yml 增加如下配置:
1 | metrics.reporter.influxdb.class: org.apache.flink.metrics.influxdb.InfluxdbReporter |
flink-metrics-prometheus
prometheus基本概念
Reporter实现
Prometheus Reporter的详细类图如下,包括继承以及依赖关系: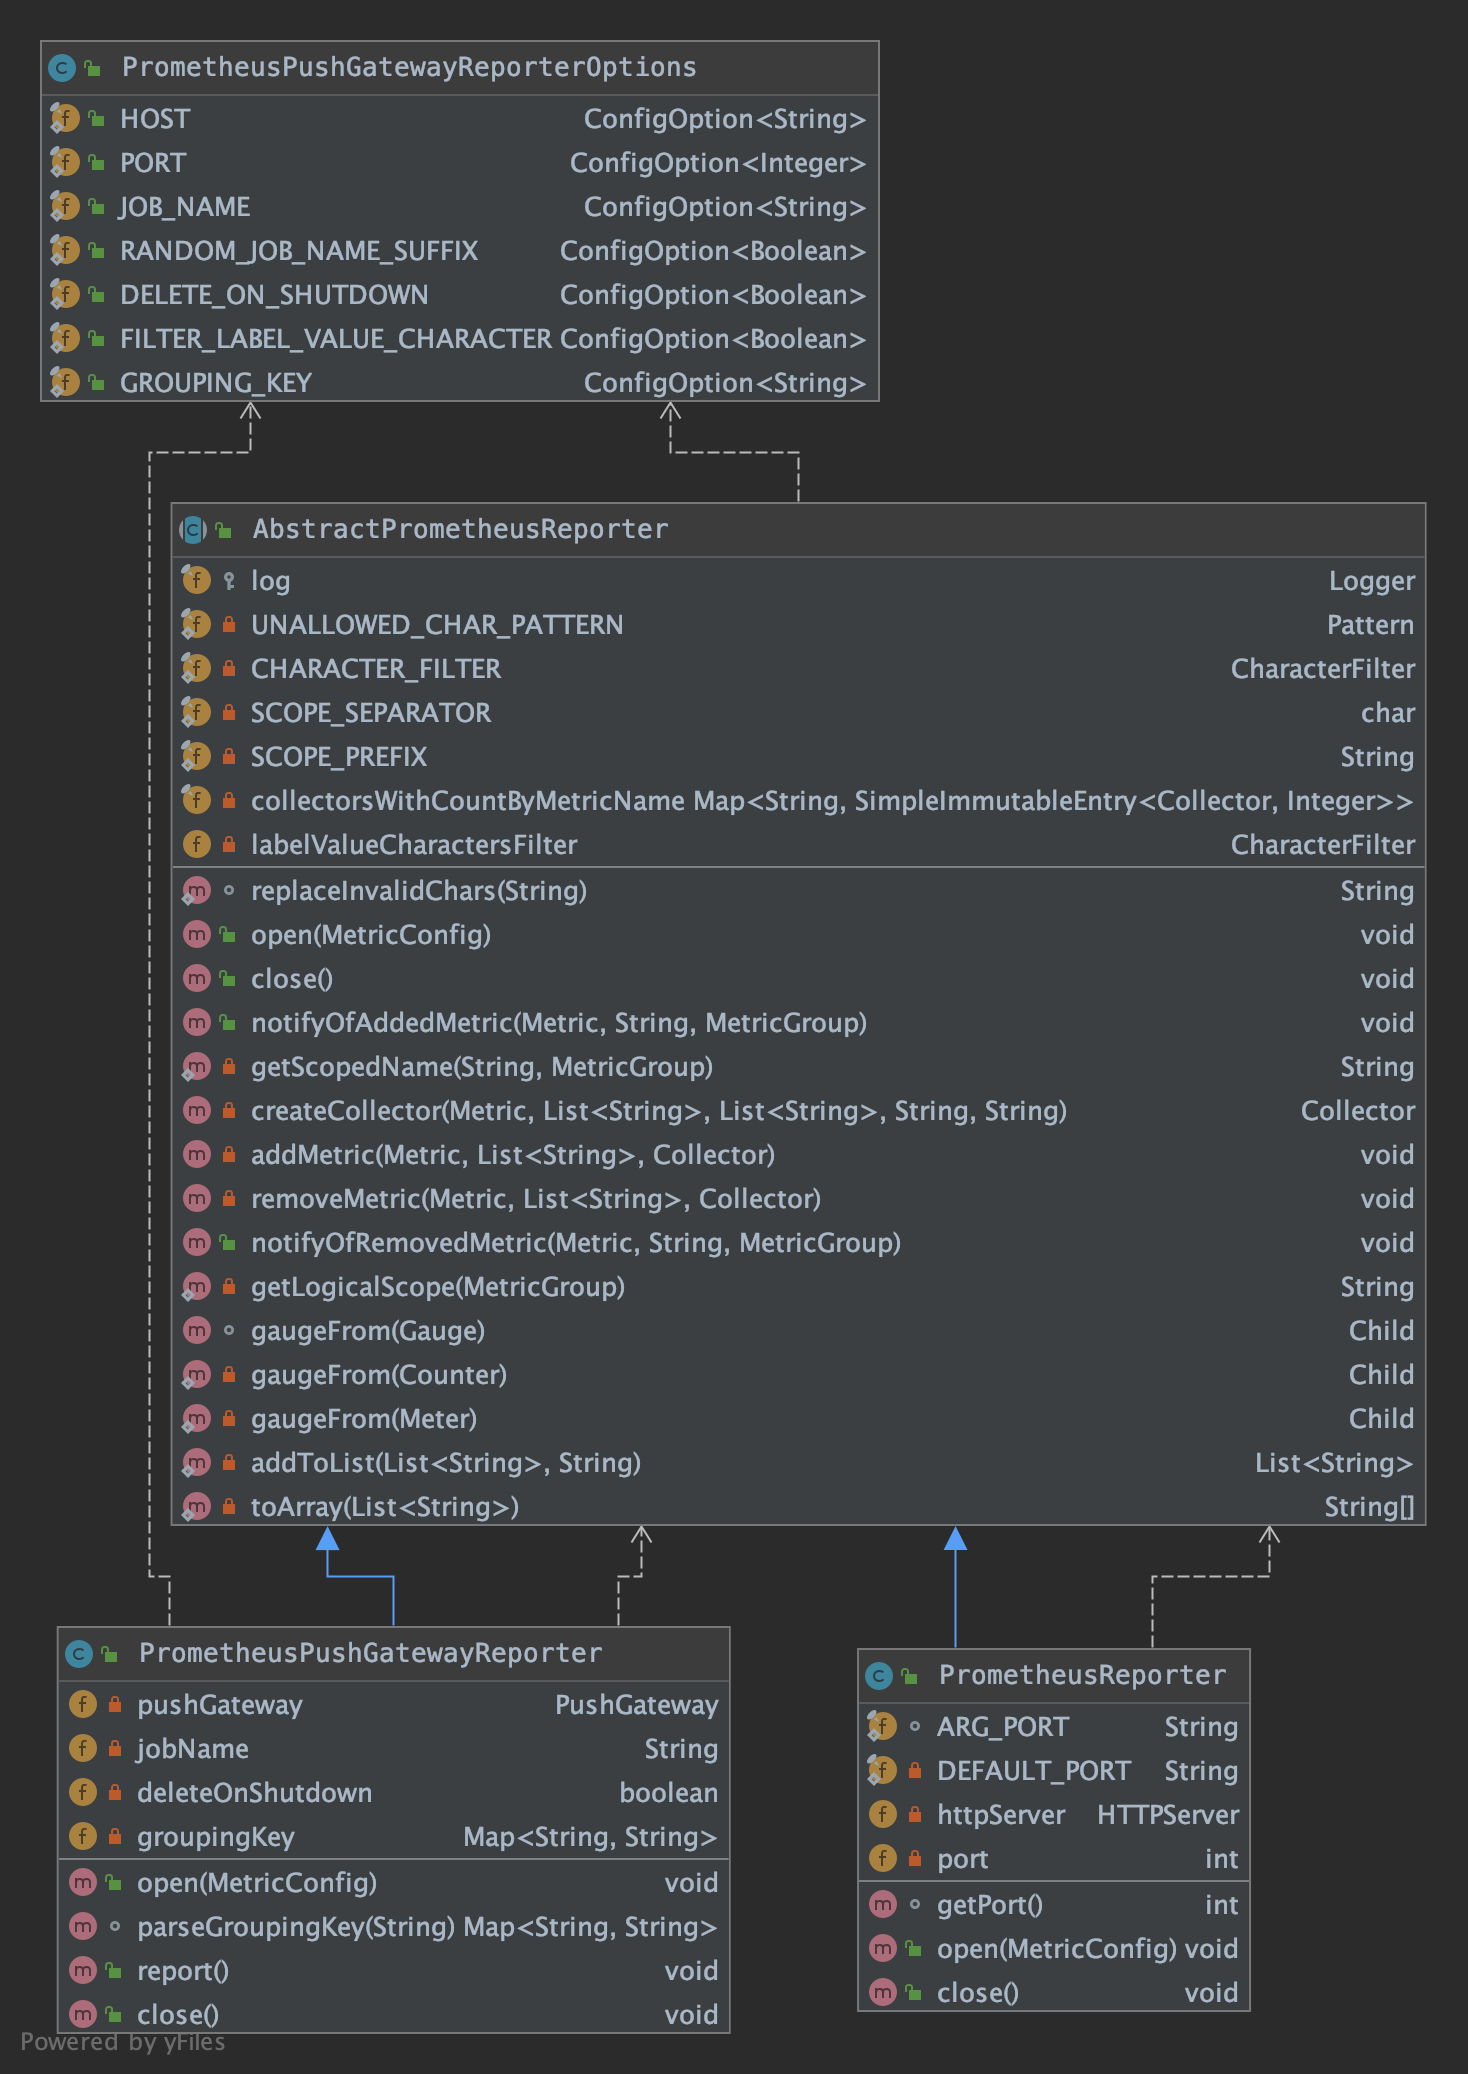
- AbstractPrometheusReporter
1
2
3
4
5
6
7
8
9
10
11
12
13
14
15
16
17
18
19
20
21
22
23
24
25
26
27
28
29
30
31
32
33
34
35
36
37
38
39
40
41
42
43
44
45
46
47
48
49
50
51
52
53
54
55
56
57
58
59
60
61
62
63
64
65
66
67
68
69
70
71
72
73
74
75
76
77
78
public void notifyOfAddedMetric(final Metric metric, final String metricName, final MetricGroup group) {
// 维度key集合
List<String> dimensionKeys = new LinkedList<>();
// 维度value集合
List<String> dimensionValues = new LinkedList<>();
for (final Map.Entry<String, String> dimension : group.getAllVariables().entrySet()) {
final String key = dimension.getKey();
dimensionKeys.add(CHARACTER_FILTER.filterCharacters(key.substring(1, key.length() - 1)));
dimensionValues.add(labelValueCharactersFilter.filterCharacters(dimension.getValue()));
}
final String scopedMetricName = getScopedName(metricName, group);
final String helpString = metricName + " (scope: " + getLogicalScope(group) + ")";
final Collector collector;
Integer count = 0;
synchronized (this) {
if (collectorsWithCountByMetricName.containsKey(scopedMetricName)) {
final AbstractMap.SimpleImmutableEntry<Collector, Integer> collectorWithCount = collectorsWithCountByMetricName.get(scopedMetricName);
collector = collectorWithCount.getKey();
count = collectorWithCount.getValue();
} else {
collector = createCollector(metric, dimensionKeys, dimensionValues, scopedMetricName, helpString);
try {
// 注册当前的 collector 到 CollectorRegistry.defaultRegistry 中
collector.register();
} catch (Exception e) {
log.warn("There was a problem registering metric {}.", metricName, e);
}
}
//
addMetric(metric, dimensionValues, collector);
collectorsWithCountByMetricName.put(scopedMetricName, new AbstractMap.SimpleImmutableEntry<>(collector, count + 1));
}
}
/**
* 将 Metric 转成 prometheus 的 Collector
*/
private Collector createCollector(Metric metric, List<String> dimensionKeys, List<String> dimensionValues, String scopedMetricName, String helpString) {
Collector collector;
if (metric instanceof Gauge || metric instanceof Counter || metric instanceof Meter) {
collector = io.prometheus.client.Gauge
.build()
.name(scopedMetricName)
.help(helpString)
.labelNames(toArray(dimensionKeys))
.create();
} else if (metric instanceof Histogram) {
collector = new HistogramSummaryProxy((Histogram) metric, scopedMetricName, helpString, dimensionKeys, dimensionValues);
} else {
log.warn("Cannot create collector for unknown metric type: {}. This indicates that the metric type is not supported by this reporter.",
metric.getClass().getName());
collector = null;
}
return collector;
}
/**
* 取出 Metric 中的值,为 Collector 设置 label values
*/
private void addMetric(Metric metric, List<String> dimensionValues, Collector collector) {
if (metric instanceof Gauge) {
((io.prometheus.client.Gauge) collector).setChild(gaugeFrom((Gauge) metric), toArray(dimensionValues));
} else if (metric instanceof Counter) {
((io.prometheus.client.Gauge) collector).setChild(gaugeFrom((Counter) metric), toArray(dimensionValues));
} else if (metric instanceof Meter) {
((io.prometheus.client.Gauge) collector).setChild(gaugeFrom((Meter) metric), toArray(dimensionValues));
} else if (metric instanceof Histogram) {
((HistogramSummaryProxy) collector).addChild((Histogram) metric, dimensionValues);
} else {
log.warn("Cannot add unknown metric type: {}. This indicates that the metric type is not supported by this reporter.",
metric.getClass().getName());
}
}
注意:从Gauge中取值时不支持返回值为String:
1 |
|
如 LatestCompletedCheckpointExternalPathGauge 这个指标,用来记录上次完成的 checkpoint 路径,它的返回值是 String 类型,在向 PrometheusPushgateway 推送的时候会报错。
1 | private class LatestCompletedCheckpointExternalPathGauge implements Gauge<String> { |
报错如下:
1 | 20:06:36.782 [Flink-MetricRegistry-thread-1] DEBUG org.apache.flink.metrics.prometheus.PrometheusPushGatewayReporter - Invalid type for Gauge org.apache.flink.runtime.checkpoint.CheckpointStatsTracker$LatestCompletedCheckpointExternalPathGauge@78b86b65: java.lang.String, only number types and booleans are supported by this reporter. |
PrometheusPushGatewayReporterOptions
连接 PrometheusPushGateway 写指标的配置项PrometheusPushGatewayReporter
open() 方法中要根据指标配置文件初始化 PushGateway 操作类:
1 | /** |
report() 方法中调用 pushgateway 的 push() 方法,直接走HTTP将指标推送出去了:
1 |
|
- PrometheusReporter
open() 方法中要根据指标配置文件初始化一个HttpServer,让 Prometheus 来拉取:
注意:PrometheusReporter 类没有实现 Scheduled 接口,没有 report() 方法,因为它的指标是拉的,不是主动推的。
1 | /** |
配置
复制 flink-metrics-prometheus-xxx.jar 到 $FLINK_HOME/lib 下
如果使用 PrometheusReporter ,则在 flink-conf.yml 增加如下配置:
1
2metrics.reporter.prom.class: org.apache.flink.metrics.prometheus.PrometheusReporter
metrics.reporter.prom.port: 9249如果使用 PrometheusPushGatewayReporter ,则在 flink-conf.yml 增加如下配置:
1
2
3
4
5
6metrics.reporter.promgateway.class: org.apache.flink.metrics.prometheus.PrometheusPushGatewayReporter
metrics.reporter.promgateway.host: localhost
metrics.reporter.promgateway.port: 9091
metrics.reporter.promgateway.jobName: myJob
metrics.reporter.promgateway.randomJobNameSuffix: true
metrics.reporter.promgateway.deleteOnShutdown: false
flink-metrics-jmx
jmx基本概念
JMX(Java Management Extensions)是一个应用程序植入管理功能的框架。JMX 是一套标准的代理和服务,实际上,用户可以在任何Java应用程序中使用这些代理和服务实现管理。
JMX 架构图如下: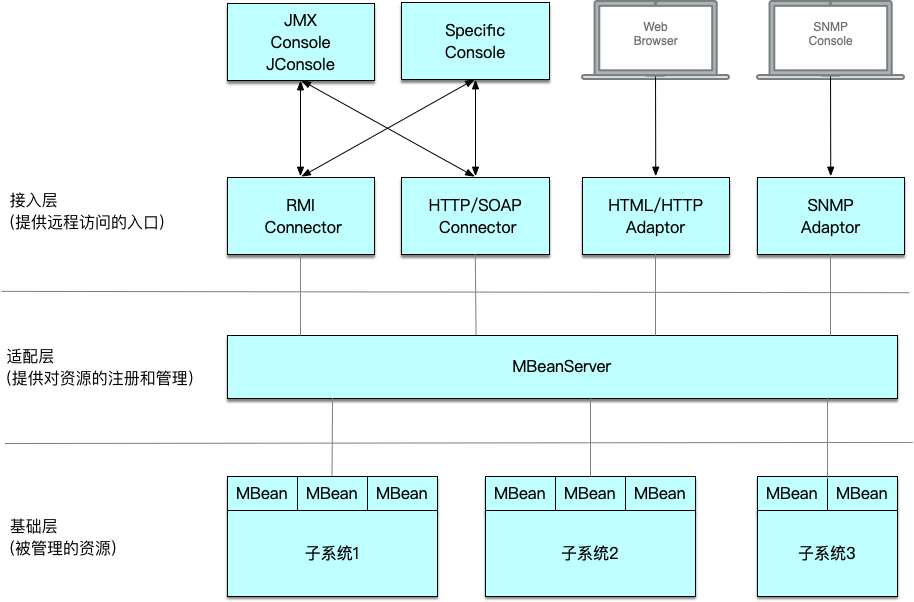
Reporter实现
- JMXReporter:
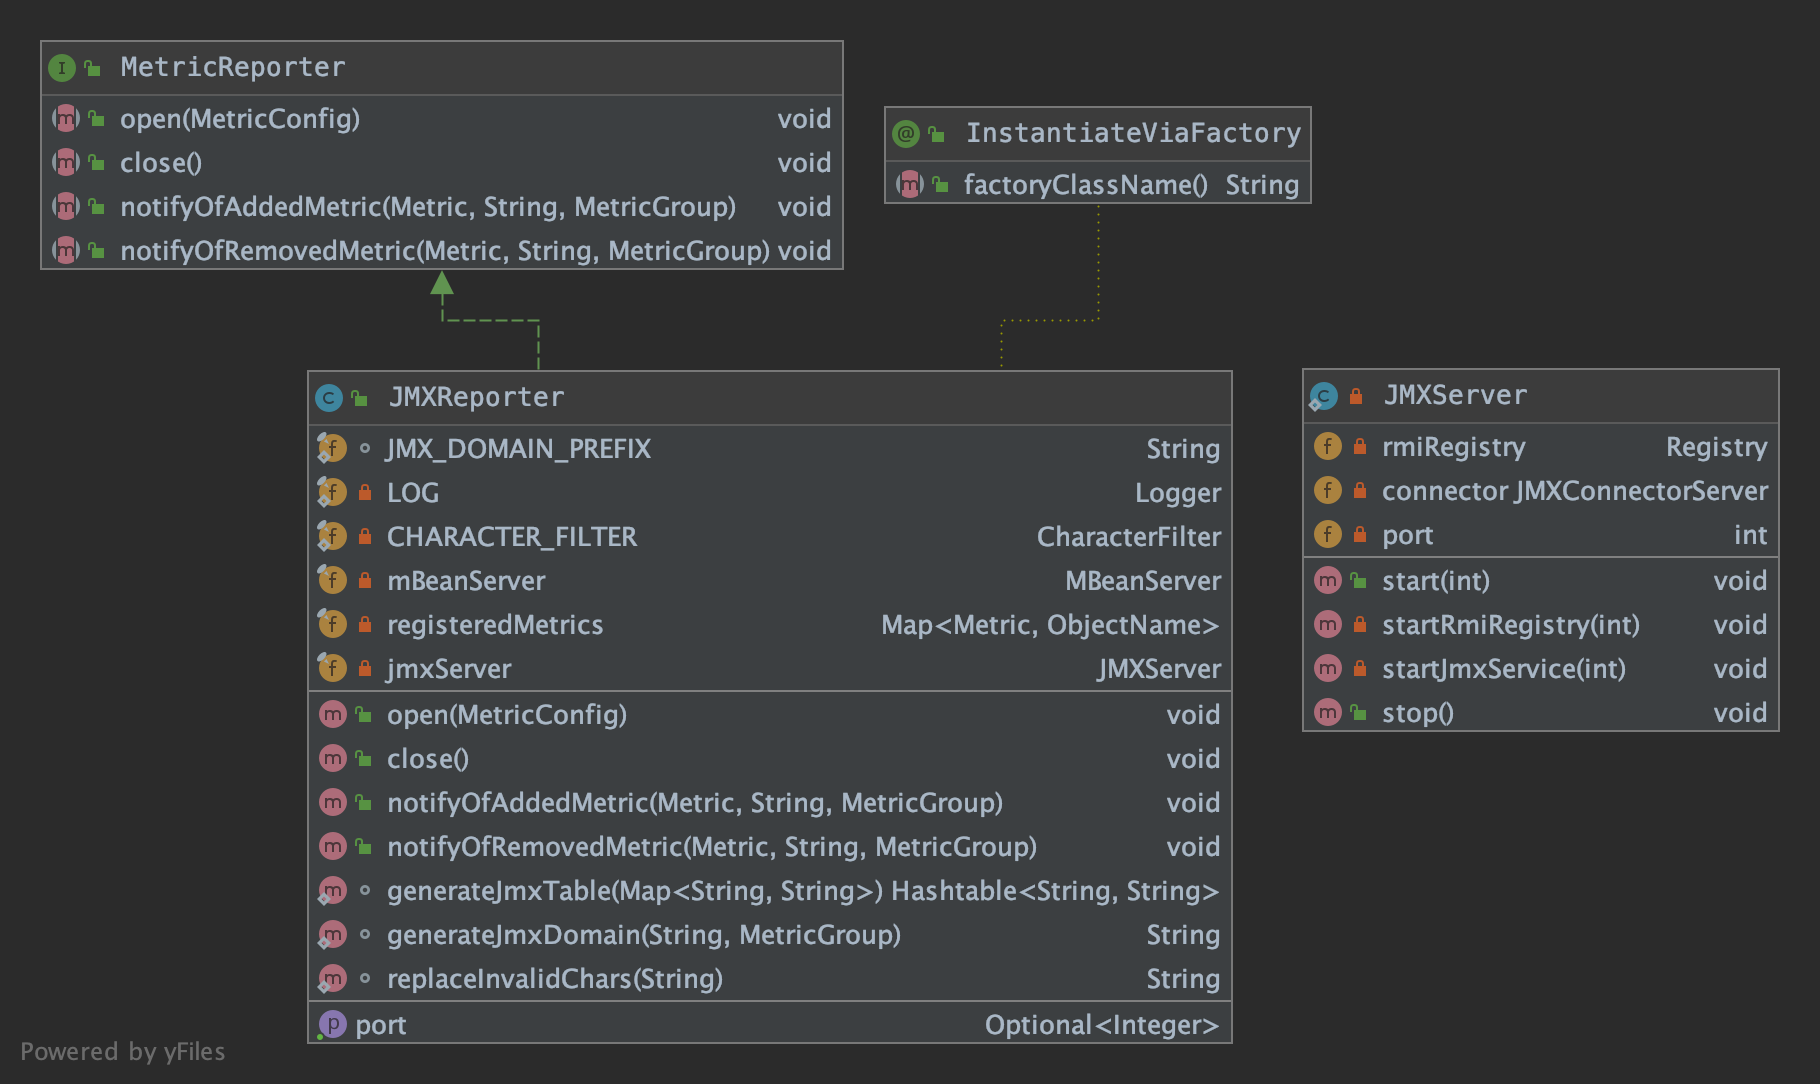
首先通过 ManagementFactory.getPlatformMBeanServer() 获取JVM中全局唯一的 MBeanServer 单例。
1 | JMXReporter( final String portsConfig) { |
- JMXRreporter中的MetricMBean:
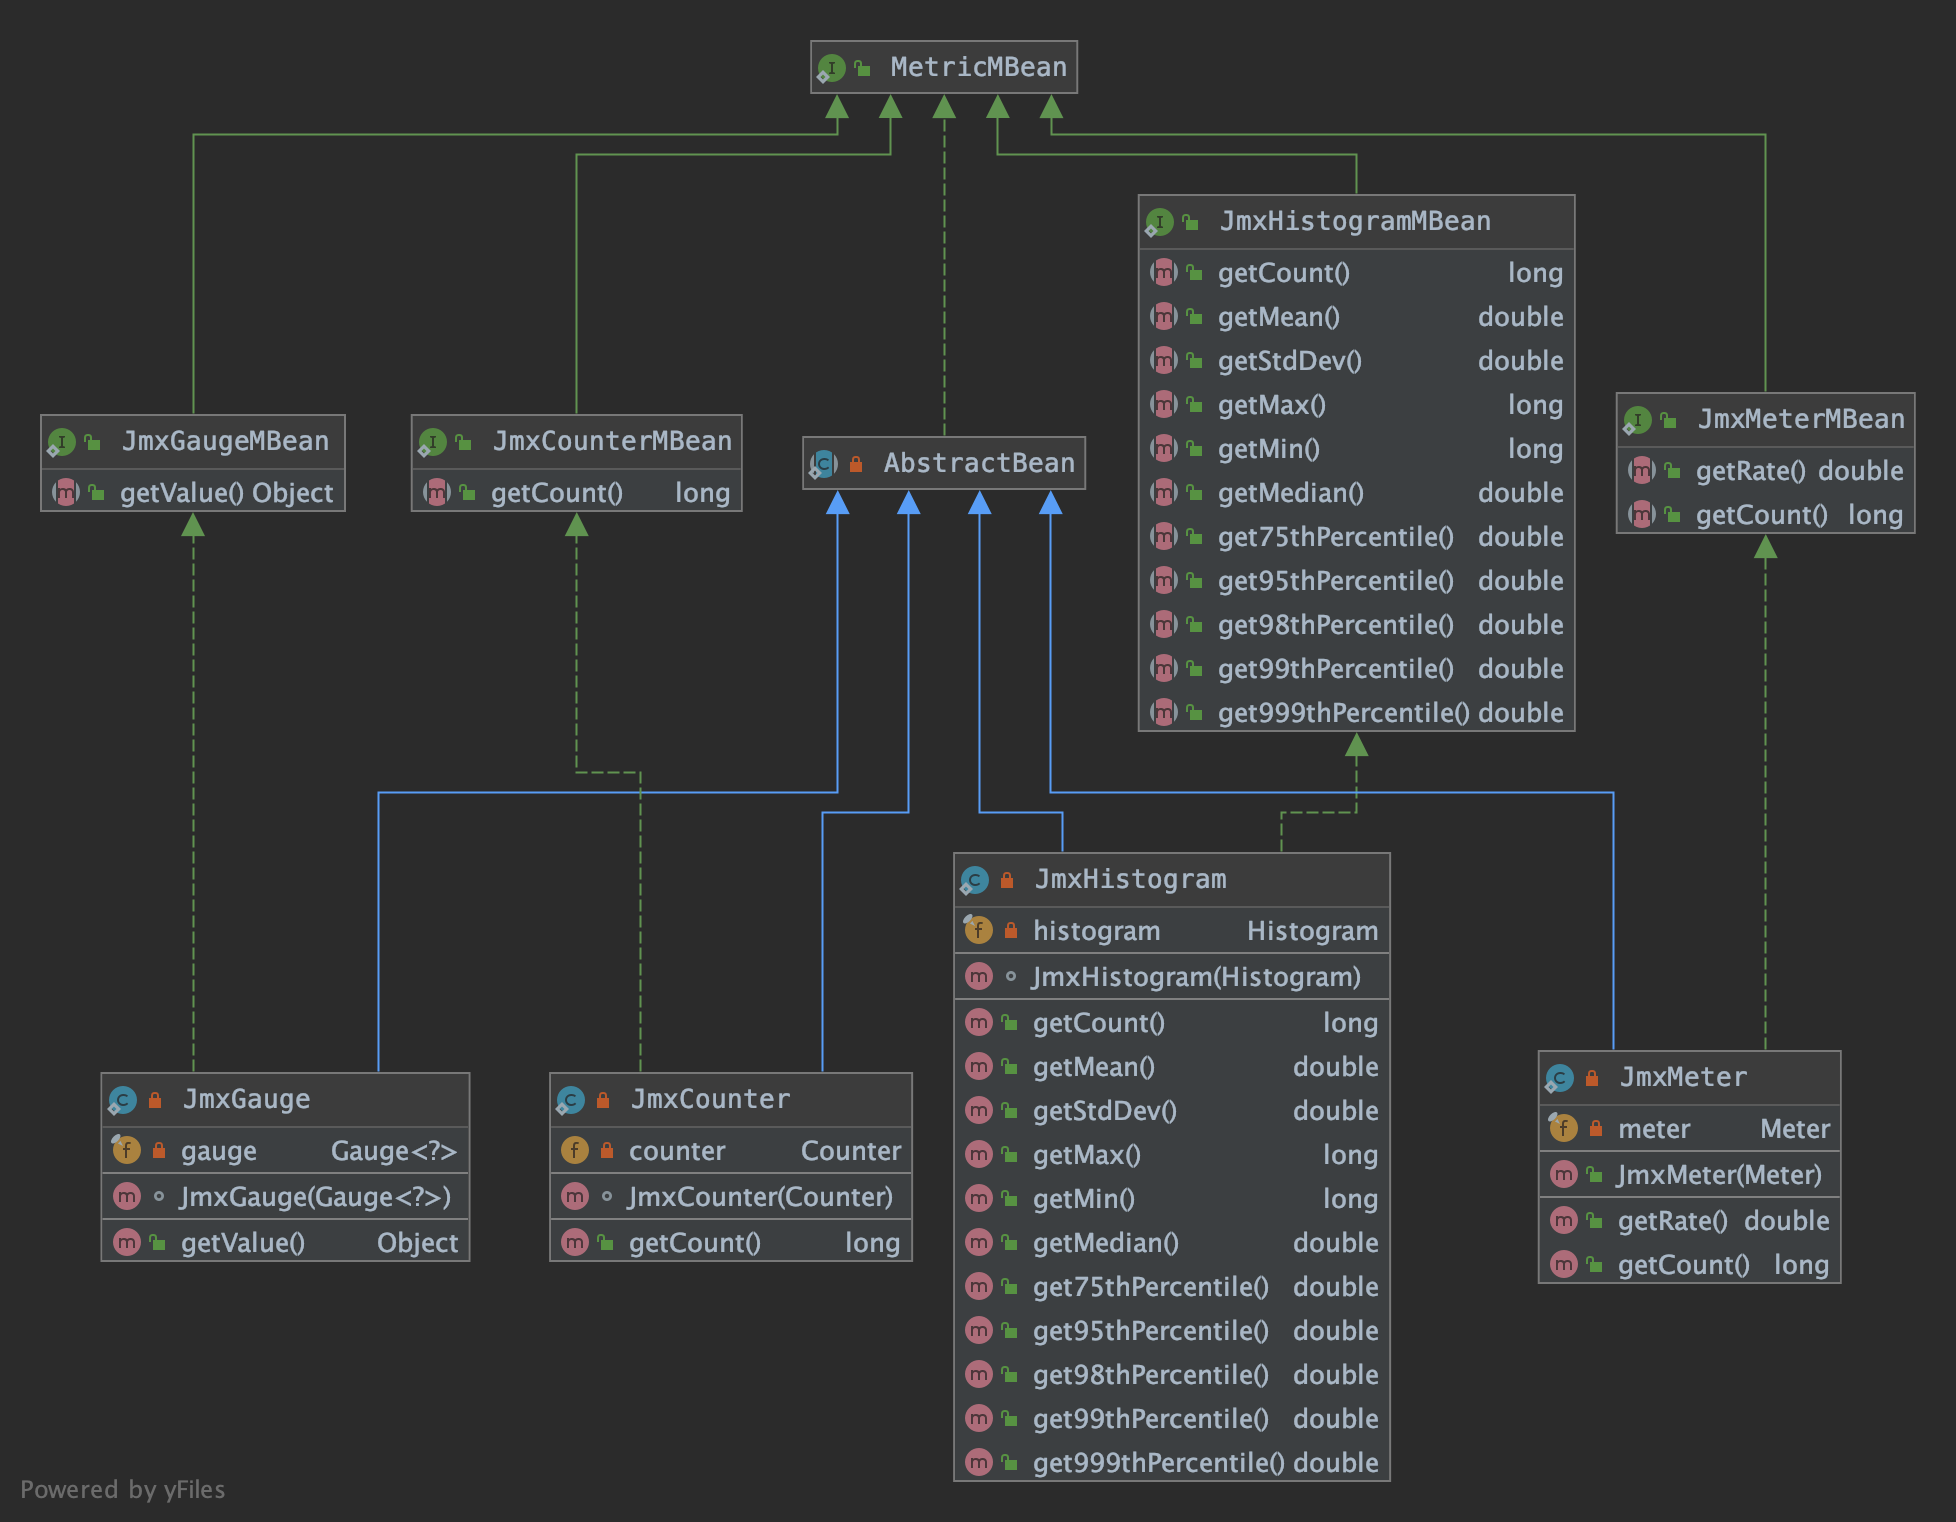
添加指标项时,需要将 flink 中的 Metric 对象转换成 MetricBean ,再注册到 MBeanServer 中:
1 |
|
配置
- 在 flink-conf.yml 增加如下配置:
1
2metrics.reporter.jmx.factory.class: org.apache.flink.metrics.jmx.JMXReporterFactory
metrics.reporter.jmx.port: 8789 # 如果有多个 TM 在同一台机器,端口可以设置成范围 9250-9260
flink-metrics-slf4j
Slf4jReporter 继承了 flink-metrics-core 模块中的 AbstractReporter,复用其添加移除指标的方法。
report() 方法的逻辑其实就是遍历所有的指标项,拼接成字符串,打印到日志文件中:
1 | private void tryReport() { |
配置
- 复制 flink-metrics-slf4j-xxx.jar 到 $FLINK_HOME/lib 下
- 在 flink-conf.yml 增加如下配置:
1
2metrics.reporter.slf4j.class: org.apache.flink.metrics.slf4j.Slf4jReporter
metrics.reporter.slf4j.interval: 60 SECONDS
flink-metrics-statsd
statsd基本概念
statsd 从狭义上讲,其实就是一个监听 UDP(Default)/TCP的守护程序。
statsd 系统包括三部分:客户端(client)、服务器(server)和后端(backend)
StatsDReporter 相当于 statsd 系统的客户端,将 metrics 上报给 statsd server,statsd server 聚合这些 metrics 之后,定时发送给 backend,
backend 则负责存储这些时间序列数据,并通过适当的图表工具展示。
statsd 经常与 graphite 一起使用,statsd 负责收集并聚合测量值,之后将数据传给 graphite ,graphite 以时间序列为依据存储数据,并绘制图表。
Reporter实现
这里我们只关注下发送 UDP 数据包的方法:
1 | private void send(final String name, final String value) { |
配置
- 复制 flink-metrics-statsd-xxx.jar 到 $FLINK_HOME/lib 下
- 在 flink-conf.yml 增加如下配置:
1
2
3metrics.reporter.stsd.class: org.apache.flink.metrics.statsd.StatsDReporter
metrics.reporter.stsd.host: localhost # the StatsD server host
metrics.reporter.stsd.port: 8125 # the StatsD server port
flink-metrics-datadog
datadog这里就不详细说了,其实就是添加指标时将 flink 中的 Metric 转成 DMetric
汇报时将 DMetric 指标封装成 DatadogHttpRequest,使用 HttpClient 发送出去
1 |
|
配置
- 复制 flink-metrics-datadog-xxx.jar 到 $FLINK_HOME/lib 下
- 在 flink-conf.yml 增加如下配置:
1
2
3
4
5
6metrics.reporter.dghttp.class: org.apache.flink.metrics.datadog.DatadogHttpReporter
metrics.reporter.dghttp.apikey: xxx # the Datadog API key
#(optional) the global tags that will be applied to metrics when sending to Datadog. Tags should be separated by comma only
metrics.reporter.dghttp.tags: myflinkapp,prod
metrics.reporter.dghttp.proxyHost: my.web.proxy.com #(optional) The proxy host to use when sending to Datadog
metrics.reporter.dghttp.proxyPort: 8080 #(optional) The proxy port to use when sending to Datadog, defaults to 8080
flink中的指标项
在看 flink 指标项时,可以
Overview
| 指标名 |
|---|
| flink_taskmanager_job_task_operator_dtNumBytesIn |
| flink_taskmanager_job_task_operator_dtNumBytesInRate |
| flink_taskmanager_job_task_operator_dtNumRecordsIn |
| flink_taskmanager_job_task_operator_dtNumRecordsInRate |
| flink_taskmanager_job_task_operator_dtNumRecordsInResolve |
| flink_taskmanager_job_task_operator_dtNumRecordsInResolveRate |
| flink_taskmanager_job_task_operator_dtNumRecordsOut |
| flink_taskmanager_job_task_operator_dtNumRecordsOutRate |
| flink_taskmanager_job_task_operator_dtDirtyData |
| flink_taskmanager_job_task_operator_topic_partition_dtTopicPartitionLag |
| flink_taskmanager_job_task_operator_dtEventDelay |
Checkpoint
| 指标名 |
|---|
| flink_jobmanager_job_lastCheckpointDuration |
| flink_jobmanager_job_lastCheckpointSize |
| flink_jobmanager_job_numberOfFailedCheckpoints |
Watermark
| 指标名 |
|---|
| flink_taskmanager_job_task_operator_currentInputWatermark |
| flink_taskmanager_job_task_operator_currentOutputWatermark |
| flink_taskmanager_job_task_operator_numLateRecordsDropped |
BackPressure
| 指标名 |
|---|
| flink_taskmanager_job_task_buffers_inPoolUsage |
| flink_taskmanager_job_task_buffers_outPoolUsage |
| flink_taskmanager_job_task_buffers_inputQueueLength |
| flink_taskmanager_job_task_buffers_outputQueueLength |
Kafka Connector
| 指标名 |
|---|
| flink_taskmanager_job_task_operator_commitsFailed |
| flink_taskmanager_job_task_operator_KafkaConsumer_topic_partition_currentOffsets |
| flink_taskmanager_job_task_operator_KafkaConsumer_records_lag_max |
JVM
| 指标名 |
|---|
| flink_jobmanager_Status_JVM_CPU_Load |
| flink_jobmanager_Status_JVM_CPU_Time |
| flink_jobmanager_Status_JVM_GarbageCollector_PS_MarkSweep_Count |
| flink_jobmanager_Status_JVM_GarbageCollector_PS_MarkSweep_Time |
| flink_jobmanager_Status_JVM_GarbageCollector_PS_Scavenge_Count |
| flink_jobmanager_Status_JVM_GarbageCollector_PS_Scavenge_Time |
| flink_jobmanager_Status_JVM_Memory_Heap_Max |
| flink_jobmanager_Status_JVM_Memory_Heap_Used |
| flink_jobmanager_Status_JVM_Memory_NonHeap_Max |
| flink_jobmanager_Status_JVM_Memory_NonHeap_Used |
| flink_jobmanager_Status_JVM_Threads_Count |
| flink_taskmanager_Status_JVM_CPU_Load |
| flink_taskmanager_Status_JVM_CPU_Time |
| flink_taskmanager_Status_JVM_GarbageCollector_G1_Old_Generation_Count |
| flink_taskmanager_Status_JVM_GarbageCollector_G1_Old_Generation_Time |
| flink_taskmanager_Status_JVM_GarbageCollector_G1_Young_Generation_Count |
| flink_taskmanager_Status_JVM_GarbageCollector_G1_Young_Generation_Time |
| flink_taskmanager_Status_JVM_Memory_Heap_Max |
| flink_taskmanager_Status_JVM_Memory_Heap_Used |
| flink_taskmanager_Status_JVM_Memory_NonHeap_Max |
| flink_taskmanager_Status_JVM_Memory_NonHeap_Used |
| flink_taskmanager_Status_JVM_Threads_Count |
指标平台化实践
首先,参考:Monitor with Prometheus And Grafana,
安装 Prometheus、pushgateway、Grafana 服务,以及学习如何在Grafana中添加指标项图标。